You may also like : Know basics of Rocket Science
Satellites in Polar orbit move from pole to pole in every orbit. For example 3 orbits of such a satellite are shown in this figure.

This
view is actually true ONLY IF we are sitting on a platform outside Earth ( but
which is rigidly tied to Earth ) and looking to Earth. So such a view is a
boring static scene wherein the Earth is stationary and the Satellite is moving
around it in almost a circular pattern. Boring .. isn’t it seeing the same circular pattern
repeating over and over again.
But such a platform is impossible to be built. So let’s try
to have a more realistic ( and a dynamic ) view. Let’s visualize these satellite orbits from a stand alone
platform fixed to solar system.
So.. what happens
now? The Earth is moving around Sun at about 14Kms/sec. Therefore the scene
that we were seeing from earlier mentioned platform is now moving with that
speed. In short now the satellite motion
gets superimposed with Earth’s movement to around Sun. So the movement of Satellite gets vectorially added with Earth’s speed.

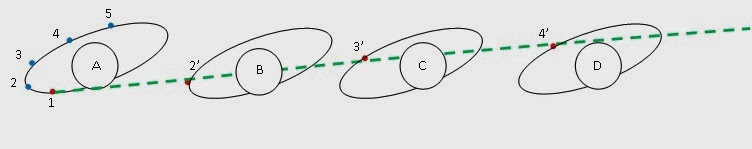
Points 1 to 5 are the positions of sunsynchronous satellite at equal interval. As the Earth moves towards right the satellite system which is a part of Earth also moves along and the Satellite movement gets vectorialy
added with Earth’s speed and point 2 in adjacent figure appears at 2' instead of at 2 when Earth has moved to position B. Similarly 3,4 5 ... etc appear at 3', 4' ,5' and so on. In this way the circular orbit appears to have been stretched and the resultant orbit shape is elongated ( like a cycloid ) as depicted by the path in green line. But there is one more complexity. The plane of the ellipse is also rotating because it has to keep a constant angle with sun ( we have taken an example of a Sunsynchronous satellite ). This motion is best viewed when looking from top ( i.e. looking into Earth through N Pole .) as seen in the adjacent figure.
So overall the circular path of satellite around Earth gets stretched like a spiral as shown in subsequent diagrams. Also the orbits appeared to be crossing over poles as seen in 1st diagram above but in reality they never cross each other in space because the Earth is not stationary as is always shown to be in all the diagrams.

We use the orbits of ‘Chandra X Ray observatory’ spacecraft to generate these graphics. Chandra orbit as drawn in conventional diagrams is on left. ( ‘Chandra’ is a NASA spacecraft for cosmic
studies named after Subramanian Chandrasekhar, 1910 -1995 ). Chandra has 133000
kms Apogee and at perigee it is as near to Earth as 16000 Kms. Inclination is
60 deg.
With 64.47 Hrs period the subsequent perigees ( or apogees )
are separated in space by (14kms/sec)*(64.47 Hrs) = 3200000 kms along the
Earth’s path around Sun ( ecliptic ).
So how does the orbit look from space?

Here is a view from a point just outside the ecliptic path and we look towards the satellite.The graphic is generated for 6
days. Earth position at 00:00 GMT everyday is shown as a blue dot while the Earth
path is seen as a pink line. Notice the
curvature caused due to Earth’s orbit around Sun along the ecliptic.
Green line is the path that Chandra Probe has taken during
this period. Notice that twice the green line has gone below the pink line. These
are 2 consecutive perigees that the spacecraft has undergone in the 6 day period. The transit of
spacecraft from one side of Earth to the other is clearly visible as a ‘twist’
below Earth path. ( If you closely observe this 'twist' is actually not a twist it is optical illusion.
Red dots on the green line are the positions of Chandra at
10 minute interval. Notice that the dots are crowded on top and are well separated
at bottom. This is due to unequal speed of spacecraft while it traverses the
orbit. When it is near to Earth ( near perigee ) its speed is maximum and so
the distance that it travels in 10 minutes is much more than the 10 minute
distance while it is away from perigee. The speed is minimum ( so the dots are
crowded ) near apogee i.e. the top edge of orbit seen in diagram.
As the spacecraft travels around Earth in an elliptical path
it is also travelling along with the Earth with Earth speed. The combination of
these speeds results in a spiral like shape as previously explained.


This is seen in the two subsequent
drawings when viewed from different angles ( chosen to bring out the features
prominently ). Left side figure is how the orbit looks when you look 'end on ' along the path of Earth. Next is when look from Top perpendicular to Ecliptic.
The curved pink line clearly brings out the Ecliptic motion of Earth
around Sun.
A much fascinating view is seen when we generate similar
drawings for Mangalyan( MOM ) because there are several orbit manuvers over a period
of time.
Orbit raising around Earth in several steps and a final
escape from Earth’s gravity gives an interesting view.

The suddenly jetting out
blue line is MAVEN spacecraft of NASA which was also launched within same time slot.
Notice that both are finally moving parallel towards MARS but MAVEN was directly launched into transfer orbit while
the MOM was placed in Transfer orbit through several sequentially increasing
orbits around Earth.
Still more breathtaking is the insertion of MOM and MAVEN into their respective MARS orbit. The Red line is MARS orboit around Sun. Blue line is MAVEN spacecraft arriving from Left and going into MARS orbits around 22nd Sept . 2 orbits are shown subsequent to insertion seen as a sharp turning when it approaches the MARS orbit.

Green line is the MOM arriving from top left corner. Its insertion is seen as a shrp change near MARS orbit. Due to lack of clarity the actual orbit around Mars is not shown.
These
are preliminary in nature ( based as per original mission plans of respective
spacecrafts ) and with available information upto last correction. ( i.e. after 1st
TCM of MOM .. TCM2 data is not yet
available ). More on these mission orbit
views will be posted soon in my ISRO related blog.
Back to Main Index
Back to Main Index
No comments:
Post a Comment